


Under the framework of:

Sponsors:


In a previous entry I spoke about ageing, income and housing in Spain. In this entry I concluded that, despite the limitations of the data, there is a problem in the income level of older people. In this new entry, I will explore the disposable income in households of people over 65 years old using data from the 2019 Living Conditions Survey (LCS) of the National Institute of Statistics. In particular, I will analyse the total net household income variable with the variation that includes imputed rent on the total net household income. The INE considers this variable for those households that are not paying a full rent because they are owners or occupiers of a property rented at a price below the market or for free. It will also be adjusted by household consumption units1.
Household selection and descriptive analysis
To select the households of people over 65 I will assume the following: if the first person responsible for the housing is over 65, then the household will be selected. Out of a total of 15 887 households, 5 221 households met this condition.
The following is a descriptive analysis of some relevant variables2 (see table 1). Approximately five out of ten households of older people have a primary education or less, three out of ten have a secondary education and the rest have a university education. In terms of marital status, most are married (51.27%) or widowed (33.29%). The 84.1% of the houses are in regime of property and the general state of health is, mainly good or regular.
Table 1. Descriptive analysis of households of people over 65 years old
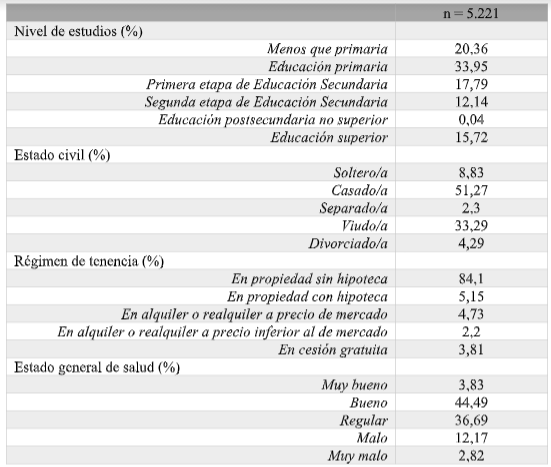
Source: Own elaboration based on data from the National Institute of Statistics (2019)
Analysis of disposable income by consumption units in households of persons aged 65 and over
The analysis of disposable income in households of persons over 65 years of age will be carried out in several terms. First, average values of disposable income per consumption unit are given. Then, this variable will be analysed graphically by including the concept of the poverty line - or relative poverty - which is calculated as 60% of the average income per consumption unit of the total population. Households below this line are in a situation of relative poverty, while those above it are not. For the total number of households in the LCS, the poverty line is 11,088.
In average terms, disposable income per consumption unit is 21,394 euros (t.d. = 11,154 euros). This result - without considering the standard deviation, since it gives us enough information - would invite us to think that in average terms the households of older people are well above the threshold - and in average terms they would be. However, this variable has an asymmetric distribution - technically, a positive asymmetry. If we order the observations - the data provided by the households - from lowest to highest and look for the value of the observation that lies just in the middle - the median income level, or median income - this will be lower than the average. In our case the median is 19,019. This means that half of the sample, some 2,600 people, have a net income below 19,019 euros (some 1,584.92 euros per month). In other words, half of the population lives on less than 1,584 euros per month and 30% of the population lives on less than 1,266 euros. These results differ from those obtained through the SHARE of the previous entry, and the differences are due to methodological aspects - for example, the INE imputes rent in the chosen variable.
Now the question is, what percentage of households live below the poverty line? The following graph3 shows the distribution of disposable income per consumption unit, including the median and the poverty line. The results show that approximately 10% of households of people over 65 years old are in a situation of relative poverty, compared to the total population of the LCS.
Chart. Distribution of net disposable income per consumption unit in people over 65 (in euros)
.png)
Source: Own elaboration based on data from the National Institute of Statistics (2019)
Survey of households below the poverty line
Providing a solution, first of all, to these households is important. But in order to do so, the situation of these households must be studied. Therefore, I will analyse, based on the variables used in the table above, what these households look like (see Table 2). In relation to the level of studies, the percentage of households whose main breadwinner is a primary school graduate increases from around 53% to 59%, and the percentage of university graduates also decreases. On the other hand, with respect to marital status, the percentage of single people increases and that of married people decreases, but the variation is small. However, it should be noted that among the 10% of most vulnerable households below the poverty line, the tenancy regime changes: the percentage of owned housing decreases by more than 20%, increasing rent almost at the same level. In addition, the state of health also worsens, moving 4% to a regular state.
Table 2. Descriptions of vulnerable households
.png)
Source: Own elaboration based on data from the National Institute of Statistics (2019)
Conclusions and some implications
The median disposable income of households of people aged 65 and over is The poverty line for households in the whole population is 11,088 Although, according to these results, nine out of every ten households of people over 65 are above this line, we cannot forget that one out of every ten households is below the line. Furthermore, a relevant fact is that 35% of these households do not own their home. If older people are normally considered to be "cash poor, but house rich", in this case, 35% of the most vulnerable households would be cash and asset poor. This, for example, would limit financial policies for equity release schemes in these households. The results of this analysis are more encouraging than those of the previous one, using SHARE, but they are still worrying. Ensuring a decent income in old age is important to avoid social and financial inclusion, but above all because it can help provide a decent standard of living.
1This value is obtained by dividing disposable income by the consumption units offered by the NSI. The consumption units are an indicator of the number of people living in the household, but adjusted with age weightings.
2In some cases observations were lost, but minimally so.
3Negative values were omitted. Values above 80,000 were omitted from the display.